Sirp
Loudspeaker analyzer
Version 1.0
User’s Guide
Ó Tolvan Data 2008
2008-10-09
Table of contents
How to adjust the cursors in panel B
Frequency response using a reference channel
Frequency response without a reference channel
How can Sirp measure distortion?
Introduction
Sirp is a
computer program for loudspeaker measurements. It can record the frequency response,
both amplitude and phase. It does so by playing logarithmic sine sweeps to the
loudspeaker and recording the response with a microphone. From the log sweeps
an impulse response is calculated. This impulse response can be truncated so
that reflections from the surroundings can be eliminated. For high frequencies
this is equivalent to having an anechoic chamber.
Sirp can
also measure the distortion of the loudspeaker as a function of frequency.
Measurements
from Sirp can be imported into Basta! version 2.0.0.0 and higher.
Overview
The signal processing in Sirp is illustrated by the figure below.
A logarithmic sweep is fed to the loudspeaker and recorded by the microphone. The spectrum (aka the fast Fourier transform (FFT)) of the microphone signal is compared to a reference spectrum of the sweep. This reference signal can come directly from the spectrum, or from a loopback signal on the soundcard. The relation between the microphone signal and the reference signal reveals the frequency response of the loudspeaker-microphone chain. This frequency response is transformed back to the time domain by the inverse fast Fourier transform (IFFT), resulting in the impulse response of the loudspeaker-microphone chain. The impulse response can be windowed such that late reflections from the room are discarded. The spectrum of this truncated impulse response then results in the anechoic response of the loudspeaker-microphone chain.
The main window
The Sirp
main window has four panels. Panel A shows the input signals, panel B the
impulse response on a log scale, panel C the truncaded impulse responses
of the individual harmonics, and panel
D the response and distortion using the truncated impulse response(s).
Panel
A
Panel A
shows the raw signals from the soundcard, ie the input signal from the device
under test (DUT), and the reference signal, typically a loopback signal from
the soundcard output. The signal sent to the soundcard can also be shown here.
Select which signals to show from the menu View|waveforms.
Panel
B
Sirp
derives the impulse response of the DUT from the signals in panel A. This
impulse response is shown in panel B. The y axis is logarithmic and expressed
in dB. The cursors are used to select which part of the impulse response that
should be used in panels C and D. Typically, the left green cursor is put on
top of the main peak of the impulse response. The red and blue cursors defines
the length of the excerpt of the signal that is used in the following
processing steps.
Panel
C
In panel C1
the excerpt form panel B is shown, but using a linear y-axis. For distortion
measurements, Sirp also determines which parts of the impulse response that
belong to the harmonic’s impulse responses and show them in panels C2 – C5 (C4
and C5 are not shown here).
Panel
D
In panel D1
the Fourier transform of the impulse responses in panel C1-C5 is shown. If the
truncating window in panel B1 is adjusted so that room reflections are
discarded, the curves in panel D1 represent the anechoic response of the
loudspeaker. Panel D2 shows the harmonics numbers 2-5 relative to harmonic
number 1, expressed in percent. Panel D3 shows the phase.
A Sirp measurement of a tweeter on a baffle. The pseudo-anechoic response of the tweeter and distortion is shown in panels D.
How to adjust the cursors in panel B
There are
different approaches on how to adjust the cursors in panel B. The selection of
strategy depends on the available acoustic environment, required measurement
distance and which frequencies that are of interest. For loudspeaker
measurement, there are mainly three different frequency ranges that makes
different measurement methods preferable:
“Tweeter
range”
The
“tweeter range”, ie the range from approximately 500-1000 Hz and upwards can be
measured under pseudo-anechoic conditions with Sirp. By finding a location for
the measurement that results at least an added pathway of some 1 to 2 meters
(~3-6 ms) for the first reflection, all reflections from the room can be
removed from the impulse response in panel B. The remaining early parts of the
impulse response will be those of the loudspeaker driver and edge diffraction
from the box. The microphone should be placed at rather a far distance, as a
rule of thumb at least two baffle widths.
“Midrange”
The range from
100-300 Hz to 700-1400 Hz is typically the most difficult frequency range to
measure. In this range, the baffle step is important, so the microphone will
need to be placed at some distance (typically at least two baffle widths), but
now the early reflections from the room are required to arrive as late as about
10-20 ms, which corresponds to an added pathway of several meters. This is in
some cases not possible. Experimenting with different placements in the room
and the settings in panel B can be very rewarding, though. It if moving the
loudspeaker-microphone combination in the room causes a peak in the impulse
response to move, one can be rather confident in that this peak was a room
reflection. Including or excluding it from the impulse response illustrates its
effect on the response.
“Bass
range”
The range
from very low frequencies to where the baffle step becomes important at 100-300
Hz if preferably measured in the close field of the loudspeaker driver or vent.
Here, the proximity to the driver will make it much louder than the reflections
from the room. By adding an appropriate attenuation and delay to the signal,
the far-field response can be well estimated. For these measurements, a very
long window can be selected.
Woofers/vents also typically have a rather long impulse response, so a
window length of 100 ms or more is often appropriate.
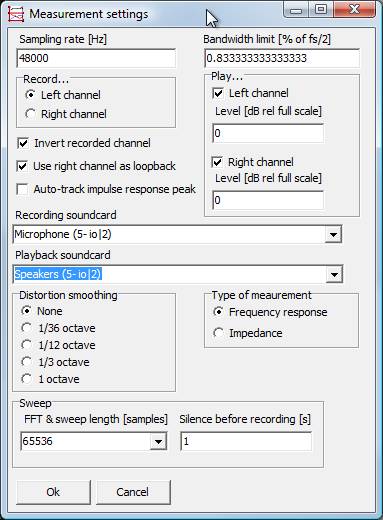
Measurement settings
Sampling
rate: Sets the
sampling rate of the soundcard. You will probably want to set this rate to the
highest sampling rate of the soundcard. On Windows XP and Vista all sounds are
resampled to a common rate for all programs, and this resampling procedure is
typically not of a sufficiently high quality for measurement purposes. On
Windows Vista this sampling rate is visible (and selectable) under Control
panel|Sound recording and playback tabs on the “advanced” tabs.
Bandwidth
limit: Frequency
sweeps in Sirp do not go all the way up to half the sampling rate. By limiting
the range slightly, there is a marging for imperfect soundcard anti-alias
filters, and it also reduces the frequency response ripple at high frequencies.
A limit of approximately 0.8333 and a sampling rate of 48000 Hz set the limit
to 20000 Hz.
Record
and play settings:
Selects the usage of left and right channels. There are also settings for
reversing the polarity of the input, if loopback is to be used and if Sirp
should try to set zero delay at the impulse response peak. The latter is
particularly useful for measurements without a loopback connection.
Recording
and playback soundcards: For systems with multiple soundcards, the soundcard can be selected
here. It is wise to use the same soundcard for playback and recording.
Smoothing: The frequency response curves can
be smoothed to reduce the fluctuations in the response.
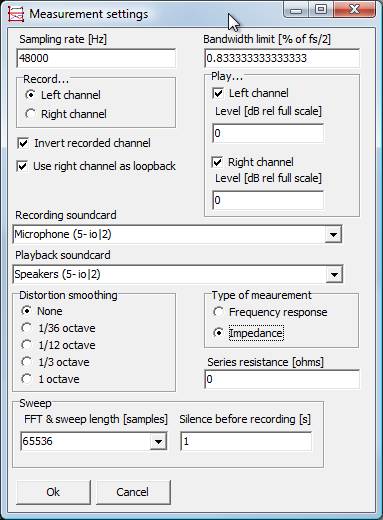
Type of
measurement: Frequency
response or impedance. For impedance measurements, the series resistance should
be entered.
Sweep
settings: The FFT
size determines the duration of the sweep. It roughly occupies half of the
playback/recording time and the duration of the entire measurement is the
number of samples in the FFT. For example an FFT size of 65536 and a sampling
rate of 48000 Hz results in a measurement time of 65536/48000=1.37 seconds.
Silence
before recording:
Allows you to set a “dead time” before the sweep starts. This might be very
useful as it can give you a short moment to hold up a microphone or make a
connection after starting the recording.
Connections
Sirp allows
for three different main types of measurements. The connections for these are
illustrated in the figure below.
Frequency
response using a reference channel
By using a
direct loopback from output A to input B, the delay in the soundcard can be
compensated for. This assures that the phase information is accurate, since no
delay apart from the loudspeaker/microphone path is added.
Some soundcards
have a high-quality built-in microphone amplifier, but the microphone
amplifiers of most standard soundcards is typically of rather poor quality.
Also, many soundcards only have a mono microphone input, or cannot handle a
microphone signal on one input and a line level signal on the other input.
Therefore, an external microphone amplifier might be needed, as in the figure.
For simple
frequency response measurements, the power amplifier can also sometimes be
omitted, depending on the driving capabilities of the soundcard. For high
quality measurements, however, the power amplifier can be considered as
mandatory.
Frequency
response without a reference channel
The
loopback can be omitted, but this introduces an unknown delay in the loop,
rendering the phase information less useful. This is not the recommended
configuration, but it can be used for quick and dirty measurements when phase
is not important.
Electrical
impedance

The
electrical impedance can be measured using the connection above. This configuration
requires a loopback connection and a series resistor. Important note: In
this connection, the power amplifier could potentially destroy the input of the
soundcard. In some cases it is better to omit the power amplifier and let the
output of the soundcard drive the resistor directly. An alternative is to make
sure that the inputs of the soundcard are protected by a series resistor, or by
using a low-power power amplifier that is not capable of delivering more
voltage than the input can take (typically a few volts).
How can Sirp measure distortion?
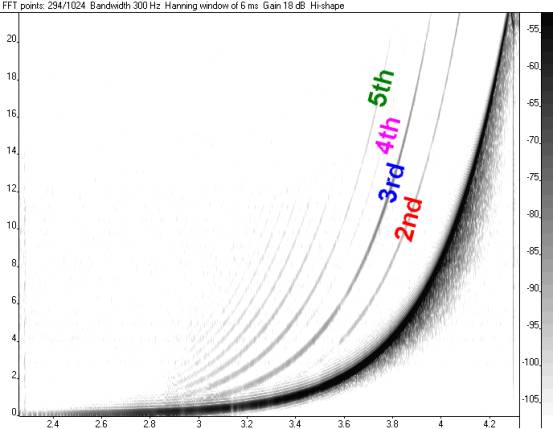
Consider
the spectrogram below. In this, the fundamental can be seen as a thick black
stripe, whose frequency increases exponentially with time. The harmonic
distortion can be seen as weaker (more gray) stripes at 2, 3, 4, 5 etc times
the fundamental frequency. The fundamental results in an impulse response after
doing the IFFT.
In order to
understand the result of the distortion harmonics, we should first consider
what would happen with the image if the system has a delay but no distortion.
Obviously, the traces fron 2nd, 3rd etc harmonics would
not be present, and the fundamental would be shifted sideways, towards a later
time. Now, looking again at the distortion components they occur at frequencies
2, 3, 4, 5 etc times higher than the fundamental. But it can be realized that
they also can be seen as a copy of the fundamental trace, but occurring earlier
in time. This relation is a direct consequence of the exponential shape of the
sweep. This in turn leads to that the distortion traces will appear as impulses
in the impulse response appearing before the main impulse. So, by
cutting out the appropriate parts of the impulse response before the main
impulse, and looking at the spectra for these, the amplitude of the each of the
harmonics of the distortion can be determined as a function of frequency.
What Sirp does not do
Sirp does
not presently offer any means of “stitching” several response curves together,
nor can it show curves from multiple measurements for comparison. Basta! ver
2.0.0.0 and higher however, can load multiple curves so that they can be
compared.
Version history
1.0.0.0
First
release.
Known problems
None so far